
Why the BOM Gives Us a Headache
- Jerome Dixon, Walt Degrange, and Aaron Luprek
- Oct 2, 2018
- 3 min read

One of our DoD clients inquired on where they could apply machine learning to improve their repair processes. What makes this process challenging is that repair personnel maintain a list of parts required to do a specific repair task. If for example, your car needs an oil change, then the list of parts for the maintenance would include one oil filter and a few quarts of oil. If the list of parts were always the same, then determining the list would be trivial. Unfortunately, there is always the possibility of performing scheduled maintenance and finding other parts that require repair. Also, there is the additional complexity of having parts replaced by newer parts. When you scale this up to a fleet of thousands of vehicles and tens of thousands of repairs per year, determining the required part list from maintenance personnel experience alone is a daunting task.
We recommended an innovative approach using natural language processing (NLP) for creating a Bill of Material (BOM).
What is a Bill of Material (BOM)?
A Bill of Material (BOM) is a breakdown of items with associated configuration data needed to repair a subassembly or component of a larger system. Usually, these are broken up into a manufacturing domain and a supply chain domain, but there may be additional domains depending on the complexity of the part and the processes needed to repair or procure.

Figure 1: The BOM connects the critical domains for a system's supportability
Oleg Shilovitsky has written several blog posts and presentations on the challenges of BOM management. His presentation provides a backdrop on the issues that make BOM management challenging.
What drives our analysis?
Operational requirements drive how many vehicles are ‘Awaiting Repair’. Accurate onhand inventory (BOM Forecast) and ‘Repair Rate’ drive the number of ‘Repaired Vehicles’ delivered. Figure 2 is a high-level depiction of our repair process.

Figure 2: High-Level Repair Process
We first match the number of ‘Repaired Vehicles’ to the ‘Repair Type’ performed over a set period of time. Our set period of time is typically the previous repair schedule.
After we match the repair types completed to the number of issues per vehicle, we then calculate the frequencies of the parts ordered.
Our final step is to divide the frequency counts by the number of vehicles per period to get a Replacement Rate (RR) per individual part. This RR with a part number now becomes our forecasted Bill of Material (BOM).
Natural Language Processing (NLP) Refresher
A term document matrix is a way of representing the words in the text as a table (or matrix) of numbers. The analysis uses the rows of the matrix to represent the text responses, and the columns of the matrix to represent the words from the text. Once in a term document matrix format, we can apply various text-mining algorithms. Figure 3 provides an example of this process.

Figure 3: NLP Bag of Words
Part numbers or National Item Identification Numbers (NIINs) can be represented as words or character vectors for text mining analysis. By representing this as a text mining problem, we gain efficiencies in computer memory utilization in addition to additional analysis methods.
Job Order Number (JON) refers to the type of repair action and the required parts and procedures required for repairs. Control Order Number (CON) refers to the higher level JON that a major repair action falls under. CONs and JONs will be our “bags” for collecting words (NIINs). Figure 4 shows a high-level view of how JONs (sentences) are made up of NIINs (words).

Figure 4: Parts Data in Array Format
BOM Building Example
We use R to create the required data structure and perform the frequency analysis.
We format our issue data into a list array by Repair Type:

Figure 5: Issue Data in List Array Data Structure

Figure 6: Issue Data – expanded
We then convert our list array to a document term matrix, count frequencies, and calculate the individual Replacement Rates.
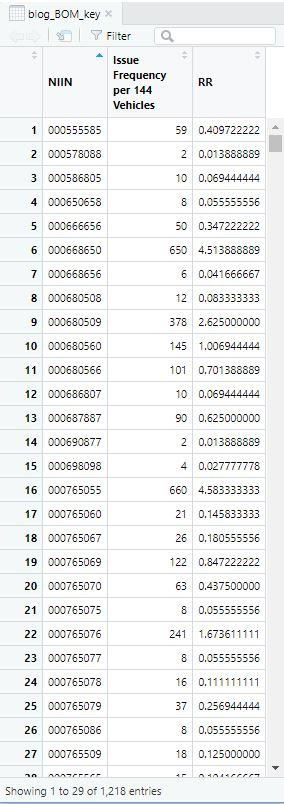
Figure 7: Final BOM
BOM Building Made Easy
Here we have shown a relatively easy, data driven approach to developing a BOM. Our goal is to reduce the workload of the repair personnel to perform BOM maintenance and create a more proactive approach to BOM management. By also monitoring repair rate trends from period to period, maintainer or senior management can identify missed configuration changes or possible changes to local repair procedures. These techniques can be applied to the manufacturing side as well.
This article was written and developed by the creative team of analysts at CANA Advisors.

Jerome Dixon is a Senior Operations Research Analyst at CANA Advisors jdixon@canallc.com

Aaron Luprek is Senior Software Developer at CANA Advisors aluprek@canallc.com

Walt DeGrange is the Director of Analytics Capabilities at CANA Advisors wdegrange@canallc.com


The free tablet status check up option allows students to track whether they will receive a tablet. It provides clear updates and helps avoid confusion. This feature is simple and useful.
I really enjoyed your post—it highlights the seamless and secure gaming experience well. Fairplay24 truly delivers with intuitive registration, strong security, and a user-friendly design. The Fairplay24 login is especially impressive—fast, reliable, and encrypted for full data protection. Your review perfectly captures that balance of functionality and trust, which makes all the difference for users exploring gaming platforms. Would love to hear how your experience compares!
Team Fairplay24
https://fairplayy24.org/
BOM is as complicated as the bone level in geometry dash meltdown – every time you jump over it, it gives you a headache, you need to memorize and practice a lot to get through it!
google seo…
03topgame 03topgame
gamesimes gamesimes;
Fortune Tiger…
Fortune Tiger…
Fortune Tiger…
EPS машины…
Fortune Tiger…
EPS Machine…
EPS Machine…
EPP Machine…
EPS Machine…
EPTU Machine…
EPS Machine…
seo seo
谷歌seo优化 谷歌SEO优化;
Fortune Tiger Slots Fortune…
Fortune Tiger Fortune Tiger;
Fortune Tiger Fortune Tiger;
Fortune Tiger Fortune Tiger;
Fortune Tiger Fortune Tiger;
Fortune Tiger Fortune Tiger;
Fortune Tiger Fortune Tiger;
EPS машины EPS машины;
EPS машины EPS машины;